
This is intended to be a brief overview of some things you should keep in mind when installing Nagios, so as set it up in a secure manner.
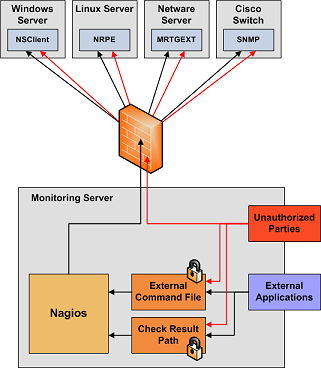
Your monitoring box should be viewed as a backdoor into your other systems. In many cases, the Nagios server might be allowed access through firewalls in order to monitor remote servers. In most all cases, it is allowed to query those remote servers for various information. Monitoring servers are always given a certain level of trust in order to query remote systems. This presents a potential attacker with an attractive backdoor to your systems. An attacker might have an easier time getting into your other systems if they compromise the monitoring server first. This is particularly true if you are making use of shared SSH keys in order to monitor remote systems.
If an intruder has the ability to submit check results or external commands to the Nagios daemon, they have the potential to submit bogus monitoring data, drive you nuts you with bogus notifications, or cause event handler scripts to be triggered. If you have event handler scripts that restart services, cycle power, etc. this could be particularly problematic.
Another area of concern is the ability for intruders to sniff monitoring data (status information) as it comes across the wire. If communication channels are not encrypted, attackers can gain valuable information by watching your monitoring information. Take as an example the following situation: An attacker captures monitoring data on the wire over a period of time and analyzes the typical CPU and disk load usage of your systems, along with the number of users that are typically logged into them. The attacker is then able to determine the best time to compromise a system and use its resources (CPU, etc.) without being noticed.
Here are some tips to help ensure that you keep your systems secure when implementing a Nagios-based monitoring solution...
- Use a Dedicated Monitoring Box. I would recommend that you install Nagios on a server that is dedicated to monitoring (and possibly other admin tasks). Protect your monitoring server as if it were one of the most important servers on your network. Keep running services to a minimum and lock down access to it via TCP wrappers, firewalls, etc. Since the Nagios server is allowed to talk to your servers and may be able to poke through your firewalls, allowing users access to your monitoring server can be a security risk. Remember, its always easier to gain root access through a system security hole if you have a local account on a box.
- Don't Run Nagios As Root. Nagios doesn't need to run as root, so don't do it. You can tell Nagios to drop privileges after startup and run as another user/group by using the nagios_user and nagios_group directives in the main config file. If you need to execute event handlers or plugins which require root access, you might want to try using sudo.
- Lock Down The Check Result Directory. Make sure that only the nagios user is able to read/write in the check result path. If users other than nagios (or root) are able to write to this directory, they could send fake host/service check results to the Nagios daemon. This could result in annoyances (bogus notifications) or security problems (event handlers being kicked off).
- Lock Down The External Command File. If you enable external commands, make sure you set proper permissions on the /usr/local/nagios/var/rw directory. You only want the Nagios user (usually nagios) and the web server user (usually nobody, httpd, apache2, or www-data) to have permissions to write to the command file. If you've installed Nagios on a machine that is dedicated to monitoring and admin tasks and is not used for public accounts, that should be fine. If you've installed it on a public or multi-user machine (not recommended), allowing the web server user to have write access to the command file can be a security problem. After all, you don't want just any user on your system controlling Nagios through the external command file. In this case, I would suggest only granting write access on the command file to the nagios user and using something like CGIWrap to run the CGIs as the nagios user instead of nobody.
- Require Authentication In The CGIs. I would strongly suggest requiring authentication for accessing the CGIs. Once you do that, read the documentation on the default rights that authenticated contacts have, and only authorize specific contacts for additional rights as necessary. Instructions on setting up authentication and configuring authorization rights can be found here. If you disable the CGI authentication features using the use_authentication directive in the CGI config file, the command CGI will refuse to write any commands to the external command file. After all, you don't want the world to be able to control Nagios do you?
- Use Full Paths In Command Definitions. When you define commands, make sure you specify the full path (not a relative one) to any scripts or binaries you're executing.
- Hide Sensitive Information With $USERn$ Macros. The CGIs read the main config file and object config file(s), so you don't want to keep any sensitive information (usernames, passwords, etc) in there. If you need to specify a username and/or password in a command definition use a $USERn$ macro to hide it. $USERn$ macros are defined in one or more resource files. The CGIs will not attempt to read the contents of resource files, so you can set more restrictive permissions (600 or 660) on them. See the sample resource.cfg file in the base of the Nagios distribution for an example of how to define $USERn$ macros.
- Strip Dangerous Characters From Macros. Use the illegal_macro_output_chars directive to strip dangerous characters from the $HOSTOUTPUT$, $SERVICEOUTPUT$, $HOSTPERFDATA$, and $SERVICEPERFDATA$ macros before they're used in notifications, etc. Dangerous characters can be anything that might be interpreted by the shell, thereby opening a security hole. An example of this is the presence of backtick (`) characters in the $HOSTOUTPUT$, $SERVICEOUTPUT$, $HOSTPERFDATA$, and/or $SERVICEPERFDATA$ macros, which could allow an attacker to execute an arbitrary command as the nagios user (one good reason not to run Nagios as the root user).
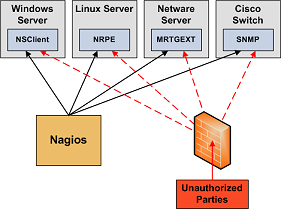
- Secure Access to Remote Agents. Make sure you lock down access to agents (NRPE, NSClient, SNMP, etc.) on remote systems using firewalls, access lists, etc. You don't want everyone to be able to query your systems for status information. This information could be used by an attacker to execute remote event handler scripts or to determine the best times to go unnoticed.
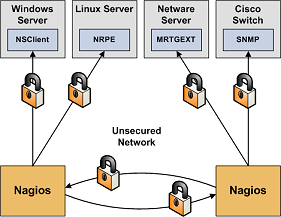
- Secure Communication Channels. Make sure you encrypt communication channels between different Nagios installations and between your Nagios servers and your monitoring agents whenever possible. You don't want someone to be able to sniff status information going across your network. This information could be used by an attacker to determine the best times to go unnoticed.

你已经安装好Nagios并运行了它,并且你开始想知道如何来更好地用它。当需要监控大量(> 1,000)主机和服务有必要来优化Nagios以增强性能。优化Nagios时有几个地方要看一下...
- 用MRTG来绘制性能统计图表。为了保留下Nagios安装过程 In order to keep track of how well your Nagios installation handles load over time and how your configuration changes affect it, you should be graphing several important statistics with MRTG. This is really, really, really useful when it comes to tuning the performance of a Nagios installation. Really. Information on how to do this can be found here.
- Use large installation tweaks. Enabling the use_large_installation_tweaks option may provide you with better performance. Read more about what this option does here.
- Disable environment macros. Macros are normally made available to check, notification, event handler, etc. commands as environment variables. This can be a problem in a large Nagios installation, as it consumes some additional memory and (more importantly) more CPU. If your scripts don't need to access the macros as environment variables (e.g. you pass all necessary macros on the command line), you don't need this feature. You can prevent macros from being made available as environment variables by using the enable_environment_macros option.
- Check Result Reaper Frequency. The check_result_reaper_frequency variable determines how often Nagios should check for host and service check results that need to be processed. The maximum amount of time it can spend processing those results is determined by the max reaper time (see below). If your reaper frequency is too high (too infrequent), you might see high latencies for host and service checks.
- Max Reaper Time. The max_check_result_reaper_time variables determines the maximum amount of time the Nagios daemon can spend processing the results of host and service checks before moving on to other things - like executing new host and service checks. Too high of a value can result in large latencies for your host and service checks. Too low of a value can have the same effect. If you're experiencing high latencies, adjust this variable and see what effect it has. Again, you should be graphing statistics in order to make this determination.
- Adjust buffer slots. You may need to adjust the value of the external_command_buffer_slots option. Graphing buffer slot statistics with MRTG (see above) is critical in determining what values you should use for this option.
- Check service latencies to determine best value for maximum concurrent checks. Nagios can restrict the number of maximum concurrently executing service checks to the value you specify with the max_concurrent_checks option. This is good because it gives you some control over how much load Nagios will impose on your monitoring host, but it can also slow things down. If you are seeing high latency values (> 10 or 15 seconds) for the majority of your service checks (via the extinfo CGI), you are probably starving Nagios of the checks it needs. That's not Nagios's fault - its yours. Under ideal conditions, all service checks would have a latency of 0, meaning they were executed at the exact time that they were scheduled to be executed. However, it is normal for some checks to have small latency values. I would recommend taking the minimum number of maximum concurrent checks reported when running Nagios with the -s command line argument and doubling it. Keep increasing it until the average check latency for your services is fairly low. More information on service check scheduling can be found here.
- Use passive checks when possible. The overhead needed to process the results of passive service checks is much lower than that of "normal" active checks, so make use of that piece of info if you're monitoring a slew of services. It should be noted that passive service checks are only really useful if you have some external application doing some type of monitoring or reporting, so if you're having Nagios do all the work, this won't help things.
- Avoid using interpreted plugins. One thing that will significantly reduce the load on your monitoring host is the use of compiled (C/C++, etc.) plugins rather than interpreted script (Perl, etc) plugins. While Perl scripts and such are easy to write and work well, the fact that they are compiled/interpreted at every execution instance can significantly increase the load on your monitoring host if you have a lot of service checks. If you want to use Perl plugins, consider compiling them into true executables using perlcc(1) (a utility which is part of the standard Perl distribution) or compiling Nagios with an embedded Perl interpreter (see below).
- Use the embedded Perl interpreter. If you're using a lot of Perl scripts for service checks, etc., you will probably find that compiling the embedded Perl interpreter into the Nagios binary will speed things up.
- Optimize host check commands. If you're checking host states using the check_ping plugin you'll find that host checks will be performed much faster if you break up the checks. Instead of specifying a max_attempts value of 1 in the host definition and having the check_ping plugin send 10 ICMP packets to the host, it would be much faster to set the max_attempts value to 10 and only send out 1 ICMP packet each time. This is due to the fact that Nagios can often determine the status of a host after executing the plugin once, so you want to make the first check as fast as possible. This method does have its pitfalls in some situations (i.e. hosts that are slow to respond may be assumed to be down), but I you'll see faster host checks if you use it. Another option would be to use a faster plugin (i.e. check_fping) as the host_check_command instead of check_ping.
- Schedule regular host checks. Scheduling regular checks of hosts can actually help performance in Nagios. This is due to the way the cached check logic works (see below). Prior to Nagios 3, regularly scheduled host checks used to result in a big performance hit. This is no longer the case, as host checks are run in parallel - just like service checks. To schedule regular checks of a host, set the check_interval directive in the host definition to something greater than 0.
- Enable cached host checks. Beginning in Nagios 3, on-demand host checks can benefit from caching. On-demand host checks are performed whenever Nagios detects a service state change. These on-demand checks are executed because Nagios wants to know if the host associated with the service changed state. By enabling cached host checks, you can optimize performance. In some cases, Nagios may be able to used the old/cached state of the host, rather than actually executing a host check command. This can speed things up and reduce load on monitoring server. In order for cached checks to be effective, you need to schedule regular checks of your hosts (see above). More information on cached checks can be found here.
- Don't use agressive host checking. Unless you're having problems with Nagios recognizing host recoveries, I would recommend not enabling the use_aggressive_host_checking option. With this option turned off host checks will execute much faster, resulting in speedier processing of service check results. However, host recoveries can be missed under certain circumstances when this it turned off. For example, if a host recovers and all of the services associated with that host stay in non-OK states (and don't "wobble" between different non-OK states), Nagios may miss the fact that the host has recovered. A few people may need to enable this option, but the majority don't and I would recommendnot using it unless you find it necessary...
- External command optimizations. If you're processing a lot of external commands (i.e. passive checks in a distributed setup, you'll probably want to set the command_check_interval variable to -1. This will cause Nagios to check for external commands as often as possible. You should also consider increasing the number of available external command buffer slots. Buffers slots are used to hold external commands that have been read from the external command file (by a separate thread) before they are processed by the Nagios daemon. If your Nagios daemon is receiving a lot of passive checks or external commands, you could end up in a situation where the buffers are always full. This results in child processes (external scripts, NSCA daemon, etc.) blocking when they attempt to write to the external command file. I would highly recommend that you graph external command buffer slot usage using MRTG and the nagiostats utility as described here, so you understand the typical external command buffer usage of your Nagios installation.
- Optimize hardware for maximum performance. NOTE: Hardware performance shouldn't be an issue unless: 1) you're monitoring thousands of services, 2) you're doing a lot of post-processing of performance data, etc. Your system configuration and your hardware setup are going to directly affect how your operating system performs, so they'll affect how Nagios performs. The most common hardware optimization you can make is with your hard drives. CPU and memory speed are obviously factors that affect performance, but disk access is going to be your biggest bottlenck. Don't store plugins, the status log, etc on slow drives (i.e. old IDE drives or NFS mounts). If you've got them, use UltraSCSI drives or fast IDE drives. An important note for IDE/Linux users is that many Linux installations do not attempt to optimize disk access. If you don't change the disk access parameters (by using a utility like hdparam), you'll loose out on a lot of the speedy features of the new IDE drives.
在Nagios发行包中含有一个名为nagiostats的工具,它与Nagios主程序一起被编译和安装。Nagios状态工具可以在线地收集各种Nagios的运行信息并将在性能调优中非常有用。可以把信息搞成要么是可阅读的要么MRTG兼容型的格式。
为获取人可阅读的在线运行Nagios性能数据的信息,使用命令行-c参数来运行nagiostats工具并指定主配置文件位置,象这样:
[nagios@lanman ~]# /usr/local/nagios/bin/nagiostats -c /usr/local/nagios/etc/nagios.cfg


	Nagios Stats 3.0prealpha-05202006
	Copyright (c) 2003-2007 Ethan Galstad (www.nagios.org)
	Last Modified: 05-20-2006
	License: GPL

	CURRENT STATUS DATA
	------------------------------------------------------
	Status File:                            /usr/local/nagios/var/status.dat
	Status File Age:                        0d 0h 0m 9s
	Status File Version:                    3.0prealpha-05202006

	Program Running Time:                   0d 5h 20m 39s
	Nagios PID:                             10119
	Used/High/Total Command Buffers:        0 / 0 / 64
	Used/High/Total Check Result Buffers:   0 / 7 / 512

	Total Services:                         95
	Services Checked:                       94
	Services Scheduled:                     91
	Services Actively Checked:              94
	Services Passively Checked:             1
	Total Service State Change:             0.000 / 78.950 / 1.026 %
	Active Service Latency:                 0.000 / 4.272 / 0.561 sec
	Active Service Execution Time:          0.000 / 60.007 / 2.066 sec
	Active Service State Change:            0.000 / 78.950 / 1.037 %
	Active Services Last 1/5/15/60 min:     4 / 68 / 91 / 91
	Passive Service State Change:           0.000 / 0.000 / 0.000 %
	Passive Services Last 1/5/15/60 min:    0 / 0 / 0 / 0
	Services Ok/Warn/Unk/Crit:              58 / 16 / 0 / 21
	Services Flapping:                      1
	Services In Downtime:                   0

	Total Hosts:                            24
	Hosts Checked:                          24
	Hosts Scheduled:                        24
	Hosts Actively Checked:                 24
	Host Passively Checked:                 0
	Total Host State Change:                0.000 / 9.210 / 0.384 %
	Active Host Latency:                    0.000 / 0.446 / 0.219 sec
	Active Host Execution Time:             1.019 / 10.034 / 2.764 sec
	Active Host State Change:               0.000 / 9.210 / 0.384 %
	Active Hosts Last 1/5/15/60 min:        5 / 22 / 24 / 24
	Passive Host State Change:              0.000 / 0.000 / 0.000 %
	Passive Hosts Last 1/5/15/60 min:       0 / 0 / 0 / 0
	Hosts Up/Down/Unreach:                  18 / 4 / 2
	Hosts Flapping:                         0
	Hosts In Downtime:                      0

	Active Host Checks Last 1/5/15 min:     9 / 52 / 164
	Scheduled:                           4 / 23 / 75
	On-demand:                           3 / 23 / 69
	Cached:                              2 / 6 / 20
	Passive Host Checks Last 1/5/15 min:    0 / 0 / 0
	Active Service Checks Last 1/5/15 min:  9 / 80 / 244
	Scheduled:                           9 / 80 / 244
	On-demand:                           0 / 0 / 0
	Cached:                              0 / 0 / 0
	Passive Service Checks Last 1/5/15 min: 0 / 0 / 0

	External Commands Last 1/5/15 min:      0 / 0 / 0

[nagios@lanman ~]#
如你所见,它显示了Nagios进程在不同统计频度上的一系列数字,有多个值在统计频度上显示,主要是(除非特别指定)最小值、最大值和平均值。
可以将nagiostats工具与MRTG或其他兼容程序集成来显示Nagios的统计结果。为完成它,用--mrtg和--data参数来运行nagiostats工具。参数--data可指定哪个哪种统计值被绘制成图,可用的值可以通过用--help命令参数运行nagiostats来查找。

注意:有关使用nagiostats来对Nagios统计状态结果绘制MRTG图表信息可以查阅这篇文档。
Nagios状态应用工具可以利用MRTG绘制多种Nagios性能统计图表。这个很重要,因为它可以:
- 确保Nagios被更有效率地操作;
- 定位监控过程中的问题;
- 感知因Nagios配置修改而导致的性能冲突影响;
绘制各种Nagios的性能统计图的MRTG配置文件片段可查看Nagios发行包里sample-config/子目录下的mrtg.cfg文件。如果需要可以创建性能信息的其他图表文件 - 样例只是提供了一个好的起点。
一旦你复制这些样例文件到你的MRTG配置文件(/etc/mrtg/mrtg.cfg)里,你将在MRTG的下次运行时得到这些新图表。
下面将描述一下几个样例MRTG图表的内容及用途...
表 10.1.
自主主机检测-该图显示了沿时间轴做过多少次自主主机检测(包括规格化计划检测和按需检测),有助于理解: | 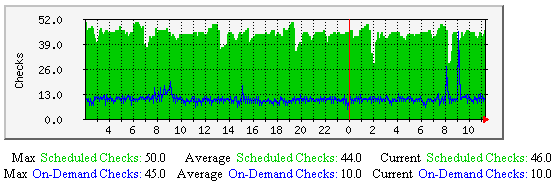 |
自主服务检测-该图显示了沿时间轴做过多少次自主服务检测(包括规格化计划检测和按需检测),有助于理解: | 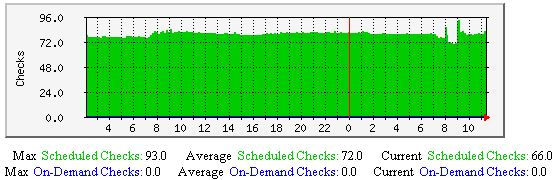 |
主机和服务检测缓存检测-该图显示了沿时间轴做过多少次主机与服务缓存检测。有助于理解: | 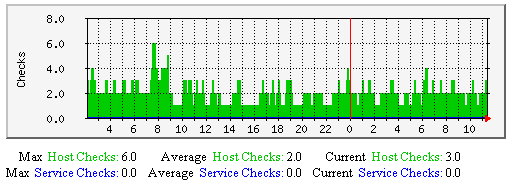 |
强制主机和服务检测-该图显示了沿时间轴做过多少次强制主机与服务检测。有助于理解: | 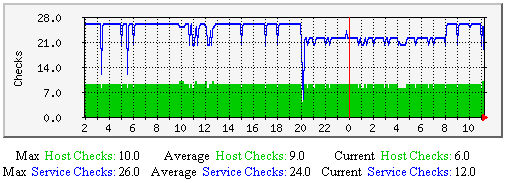 |
主机和服务自主检测-该图显示了沿时间轴上持续地有多少个主机与服务(总数量)自主检测。有助于理解: | 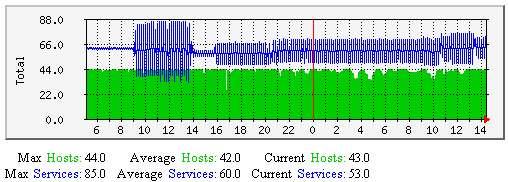 |
主机和服务强制检测-该图显示了沿时间轴上持续地有多少个主机与服务(总数量)强制检测。有助于理解: | 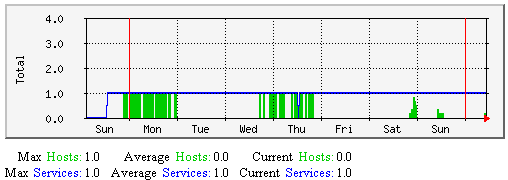 |
服务检测传输时延与执行的平均时间-该图显示了沿时间轴上有关服务检测的传输时延和执行时间的平均值。有助于理解: 若是有居高不下的传输时延可能是由于下列参数需要调整: | 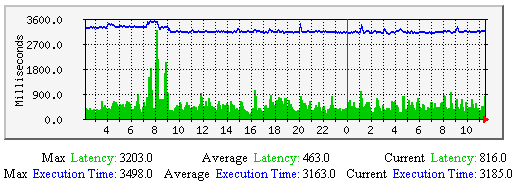 |
服务状态改变的平均值-该图显示了沿时间轴服务状态改变的百分比(变化率的度量),不论是在自主还是强制方式,最后一次检测显示服务中止的情况。有助于理解: | 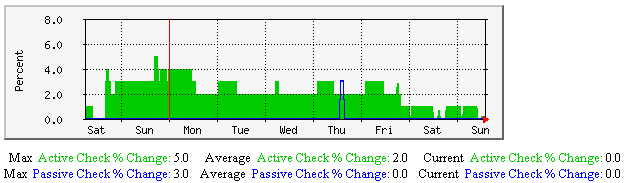 |
主机检测的传输时延与执行的平均时间-该图显示了沿时间轴上主机检测传输时延和执行时间的平均值。有助于理解: 若有居高不下的传输时延可能需要调整下列参数: | 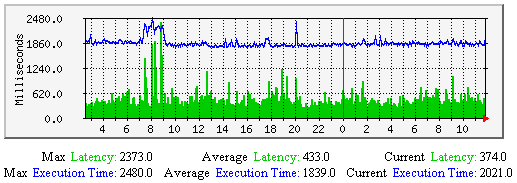 |
平均主机状态改变-该图显示了沿时间轴主机状态发生变化的百分比(变化率的度量),不论是自主还是强制检测方式,最后一次主机检测的中止情况。有助于理解: | 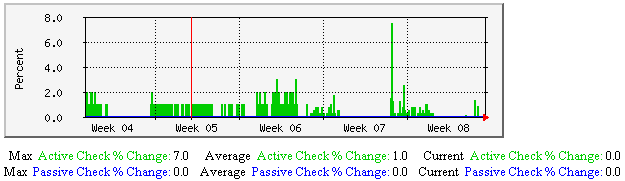 |
外部命令-该图显示了Nagio主守护进程沿时间轴有多少个外部命令要处理。除非要处理大量的外部命令(如在分布式安装环境下),该图基本上是空白的。监视外部命令将有助于如下内容的影响理解: | 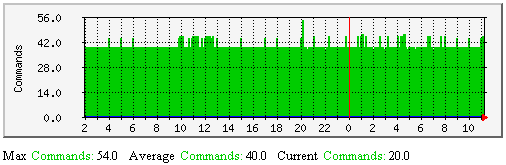 |
外部命令缓冲-该图显示了沿时间轴多少外部命令使用缓冲。如果使用中的缓冲数量接近了可用缓冲数量,说明需要增加可用的外部命令缓冲块。每个缓冲块可存放一个外部命令。缓冲被用于临时存入外部文件,临时期开始于外部命令自外部命令文件中取出时刻,结束于Nagios守护程序处理完成外部命令结果。 | 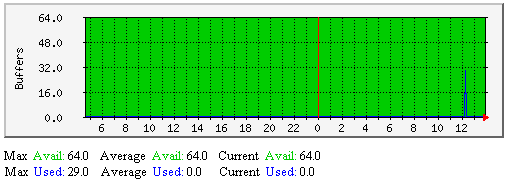 |
在此之前,很重要的一点是要理解联系人授权与认证的含义及两者的不同之处,主要有:
- 一个认证用户是指有权以指定的用户名和口令通过WEB服务器认证可以获取Nagios的WEB接口页面的用户;
- 一个认证的联系是是在联系人定义文件里的短用户名中列出的用户名;
假定你已经按快速指南里的方式配置好Web服务器,在调用Nagios的CGI程序模块前要认证。而且已经有了一个用户帐号(nagiosadmin)或对CGI模块操作。
想定义更多的联系人来接收主机和服务的通知,一般是想让联系人通过Nagios的Web接口来做。可以按下面命令来给CGI程序指定额外的用户,把下面<username>用真实的想加入的用户名来替换。一般情况下,这个名字应是与配置文件中的联系人对象定义中的短名称相匹配。
htpasswd /usr/local/nagios/etc/htpasswd.users <username>
下一步是配置CGI模块使用认证与授权功能来决定什么样的信息或是命令可以操作。把CGI配置文件里面的use_authentication选项置为非零值,如:
use_authentication=1
好了,设置好CGI模块的认证与授权了。
当使能了认证与授权功能后,CGI模块将给用户什么默认许可呢?
认证的联系人*可以取得每个以他为联系人的每个服务(联系人不是他的服务不行)...
- 授权查看服务状态信息;
- 授权查看服务配置信息;
- 授权查看该服务的历史与通知;
- 授权发出服务命令
认证的联系人*可以对每个以他为联系人的每个主机(联系人不是他的主机不行)...
- 授权查看主机状态信息;
- 授权查看主机配置信息;
- 授权查看主机的历史和通知;
- 授权发出主机命令;
- 授权查看在该主机上全部服务的状态信息;
- 授权查看在该主机上全部服务的配置信息;
- 授权查看在该主机上全部服务的历史与通知;
- 授权给在该主机上全部服务发出命令。
重要一点是默认情况下以下内容无人被授权得到如下内容...
毫无疑问需要这些信息,所以要看下面的内容以使你(可能包括其他人)有权限得到这些额外的信息...
可以允许让认证的联系人或其他认证的用户有权限得到CGI模块里的额外信息,通过在CGI配置文件里增加一些授权变量来实现。我实现了如下的授权变量以使他们可以控制无授权的情况下不能取得信息,总归比没有这些要好吧...
在CGI配置文件里加了如下的变量控制额外的授权内容...
如果被各种各样的CGI模块里所需要的授权搞糊涂了,可以看一下每个CGI模块介绍里所写的授权要求的说明,在这个文档里面。
如果WEB服务器是建在一个加密域(象在防火墙后面)或是用SSL加密通讯的,可以设置一个默认用户来完成CGI操作。可以在CGI配置文件里设置default_user_name选项。通过设置一个默认的用户来操作CGI模块,可以不必再由WEB服务器来做验证。这样通过因特网,可以省去基本的WEB认证过程,或以空白的口令进行基本认证(基本数据已经加过密了)。
Important:不要使用默认的用户名这个功能,除非运行在个加密的Web服务或加密域里,每个人都经过了充分认证后才会操作CGI模块,因为此时没有经过Web认证的每一个用户都具备相同的、全部的设置操作权限!
如果你安装了Nagios的客户端,你可能需要定制自已的CGI模块的页面头和尾以显示自己的信息。这对于向最终用户提供联系人信息等内容时比较有用。
很重要一点是,除非它们会被执行,否则用户自定制的页面头和尾的内容在显示之前不会被预先处理。页面的头和尾内容包含文件只是被简单地读入并显示到CGI页面上,这意味着头和尾的定义中只能包含一些特定的可被浏览器支持的内容(如HTML、JavaScript等)。
如果用户定制的头和尾文件是可执行的,它们会在CGI模块被调用时显示到最终用户的浏览器,因而它们必须是合法的HTML结果。利用这一点可以执行你定制的CGI程序来插入到Nagios的显示数据之中,这已被用于从RRDTOOL中获取的图表(用ddraw命令)或是在Nagios的显示板上显示命令菜单。可执行的用户定制的CGI页面的头和尾与Nagios的CGI程序使用相同的CGI环境,因而你的CGI程序可以同样地解析URL调用行信息、用户验证信息等以制作出你的输出内容。
你可以把CGIs程序模块所包含的用户定制头尾内容,经常是HTML文件放在Nagios的HTML的ssi/子目录中,一般是在这个位置/usr/local/nagios/share/ssi上。
用户定制头通常是紧跟在CGI的<BODY>标记之后而尾经常是跟在</BODY>标记之前。
有两种类型的用户定制的头和尾:
- 全局的头和尾定义。文件必须分别被命名为common-header.ssi和common-footer.ssi。如果它们被定义,它们将被全部的CGI程序模块所调用显示。
- 特定的CGI模块的用户定制的头和尾。文件必须被命名为如下格式CGINAME-header.ssi和CGINAME-footer.ssi,这里的CGINAME是那个CGI程序模块不带有.cgi后缀的部分。比如给报警汇总CGI模块即(summary.cgi)的头和尾必须分别被命名为summary-header.ssi和summary-footer.ssi。
如果你并不需要用户定制的头和尾,你可以只用全局的头定义或是全局的尾定义,真的要看你所需了。