动态追踪技术
主要的动态追踪工具有:ftrace、perf、eBPF(bcc)、SystemTap、sysdig。
这里只简单整理一下,以后在实践中加深了解。
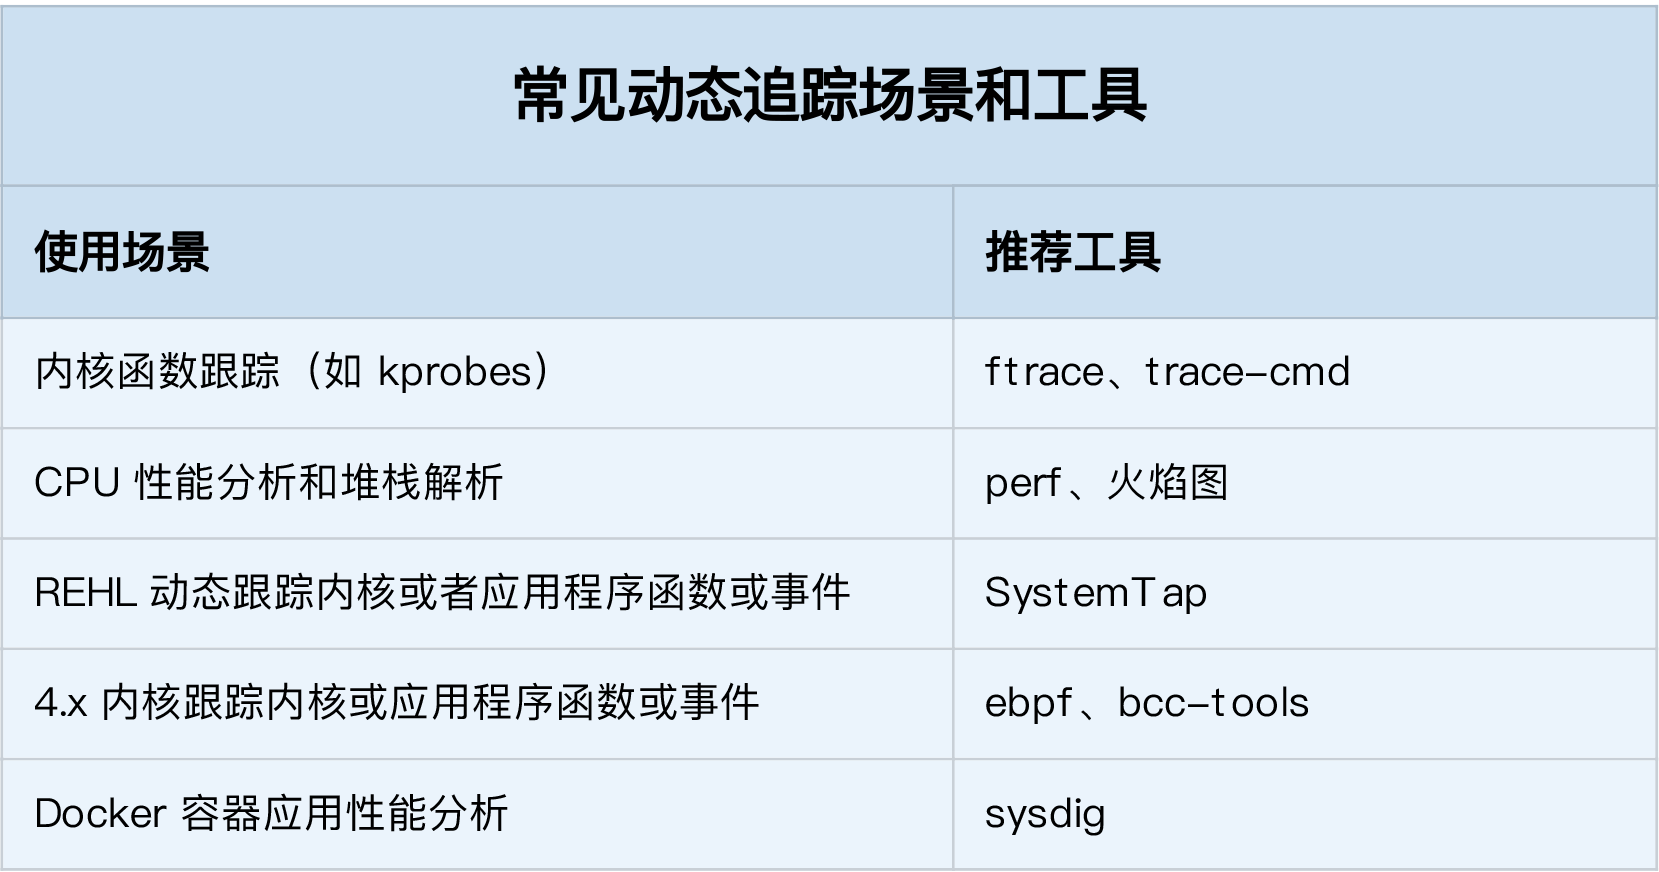
如果使用的是新版本内核,eBPF和BCC是最灵活的动态追踪方法,在旧版本的内核中,因为eBPF受限,SystemTap和ftrace是比较好的选择。
ftrace与trace-cmd
ftrace通过debugfs提供用户态接口,debugfs需要事先挂载:
mount -t debugfs nodev /sys/kernel/debug
debugfs中提供多个虚拟文件:
$ ls /sys/kernel/debug/tracing
README                      instances            set_ftrace_notrace  trace_marker_raw
available_events            kprobe_events        set_ftrace_pid      trace_options
...
ftrace用起来比较繁琐,trace-cmd简化了ftrace的使用:
yum install trace-cmd
trace-cmd用法:
$ trace-cmd record -p function_graph -g do_sys_open -O funcgraph-proc ls
$ trace-cmd report
...
ls-12418 [000] 85558.075341: funcgraph_entry:              |  do_sys_open() {
ls-12418 [000] 85558.075363: funcgraph_entry:              |    getname() {
ls-12418 [000] 85558.075364: funcgraph_entry:              |      getname_flags() {
ls-12418 [000] 85558.075364: funcgraph_entry:              |        kmem_cache_alloc() {
ls-12418 [000] 85558.075365: funcgraph_entry:              |          _cond_resched() {
ls-12418 [000] 85558.075365: funcgraph_entry:   0.074 us   |            rcu_all_qs();
ls-12418 [000] 85558.075366: funcgraph_exit:    1.143 us   |          }
ls-12418 [000] 85558.075366: funcgraph_entry:   0.064 us   |          should_failslab();
ls-12418 [000] 85558.075367: funcgraph_entry:   0.075 us   |          prefetch_freepointer();
ls-12418 [000] 85558.075368: funcgraph_entry:   0.085 us   |          memcg_kmem_put_cache();
ls-12418 [000] 85558.075369: funcgraph_exit:    4.447 us   |        }
ls-12418 [000] 85558.075369: funcgraph_entry:              |        __check_object_size() {
ls-12418 [000] 85558.075370: funcgraph_entry:   0.132 us   |          __virt_addr_valid();
ls-12418 [000] 85558.075370: funcgraph_entry:   0.093 us   |          __check_heap_object();
ls-12418 [000] 85558.075371: funcgraph_entry:   0.059 us   |          check_stack_object();
ls-12418 [000] 85558.075372: funcgraph_exit:    2.323 us   |        }
ls-12418 [000] 85558.075372: funcgraph_exit:    8.411 us   |      }
ls-12418 [000] 85558.075373: funcgraph_exit:    9.195 us   |    }
...
perf 跟踪内核函数
查看perf支持的事件:
$ perf list

List of pre-defined events (to be used in -e):

  alignment-faults                                   [Software event]
  context-switches OR cs                             [Software event]
  cpu-clock                                          [Software event]
  cpu-migrations OR migrations                       [Software event]
  dummy                                              [Software event]
  emulation-faults                                   [Software event]
  ...
添加探针:
$ perf probe --add do_sys_open
Added new event:
  probe:do_sys_open    (on do_sys_open)
You can now use it in all perf tools, such as:
    perf record -e probe:do_sys_open -aR sleep 1
使用探针采样:
$ perf record -e probe:do_sys_open -aR sleep 10
[ perf record: Woken up 1 times to write data ]
[ perf record: Captured and wrote 0.148 MB perf.data (19 samples) ]
查看采样结果:
$ perf script
            perf 12886 [000] 89565.879875: probe:do_sys_open: (ffffffffa807b290)
           sleep 12889 [000] 89565.880362: probe:do_sys_open: (ffffffffa807b290)
           sleep 12889 [000] 89565.880382: probe:do_sys_open: (ffffffffa807b290)
           sleep 12889 [000] 89565.880635: probe:do_sys_open: (ffffffffa807b290)
           sleep 12889 [000] 89565.880669: probe:do_sys_open: (ffffffffa807b290)
查看内核函数的参数,需要安装debufinfo:
yum --enablerepo=base-debuginfo install -y kernel-debuginfo-$(uname -r):
$ perf probe -V do_sys_open
Available variables at do_sys_open
        @<do_sys_open+0>
                char*   filename
                int     dfd
                int     flags
                struct open_flags       op
                umode_t mode
删除探针:
perf probe --del probe:do_sys_open
添加带参数的探针:
$ perf probe --add 'do_sys_open filename:string'
Added new event:
  probe:do_sys_open    (on do_sys_open with filename:string)
You can now use it in all perf tools, such as:
    perf record -e probe:do_sys_open -aR sleep 1
采样结果将是这样的:
$ perf script
perf 13593 [000] 91846.053622: probe:do_sys_open: (ffffffffa807b290) filename_string="/proc/13596/status"
  ls 13596 [000] 91846.053995: probe:do_sys_open: (ffffffffa807b290) filename_string="/etc/ld.so.cache"
  ls 13596 [000] 91846.054011: probe:do_sys_open: (ffffffffa807b290) filename_string="/lib/x86_64-linux-gnu/libselinux.so.1"
  ls 13596 [000] 91846.054066: probe:do_sys_open: (ffffffffa807b290) filename_string="/lib/x86_64-linux-gnu/libc.so.6”
  ...
perf 跟踪链接库函数
查看指定二进制文件(-x /bin/bash)可以追踪的所有的函数:
$ perf probe -x /bin/bash —funcs
查看函数的参数,需要安装有对应的debuginfo:
$ perf probe -x /bin/bash -V readline
Available variables at readline
        @<readline+0>
                char*   prompt
为 /bin/bash 添加 readline 探针:
$ perf probe -x /bin/bash 'readline%return +0($retval):string’
开始采样:
$ perf record -e probe_bash:readline__return -aR sleep 5
查看结果:
$ perf script
    bash 13348 [000] 93939.142576: probe_bash:readline__return: (5626ffac1610 <- 5626ffa46739) arg1="ls"
删除探针
$ perf probe --del probe_bash:readline__return
perf trace 与 trace
trace命令通过系统调用ptrace获取进程的调用系统情况,它会频繁在内核态和用户态切换,影响目标进程的性能,ptrace又会用SIGSTOP信号挂起目标进程,影响目标进程的行为。
perf trace基于内核事件,性能要好很多:
$ perf trace ls
         ? (         ): ls/14234  ... [continued]: execve()) = 0
     0.177 ( 0.013 ms): ls/14234 brk(                                                                  ) = 0x555d96be7000
     0.224 ( 0.014 ms): ls/14234 access(filename: 0xad98082                                            ) = -1 ENOENT No such file or directory
     0.248 ( 0.009 ms): ls/14234 access(filename: 0xad9add0, mode: R                                   ) = -1 ENOENT No such file or directory
     0.267 ( 0.012 ms): ls/14234 openat(dfd: CWD, filename: 0xad98428, flags: CLOEXEC                  ) = 3
     0.288 ( 0.009 ms): ls/14234 fstat(fd: 3</usr/lib/locale/C.UTF-8/LC_NAME>, statbuf: 0x7ffd2015f230 ) = 0
     0.305 ( 0.011 ms): ls/14234 mmap(len: 45560, prot: READ, flags: PRIVATE, fd: 3                    ) = 0x7efe0af92000
     0.324 Dockerfile  test.sh
( 0.008 ms): ls/14234 close(fd: 3</usr/lib/locale/C.UTF-8/LC_NAME>                          ) = 0
     ...
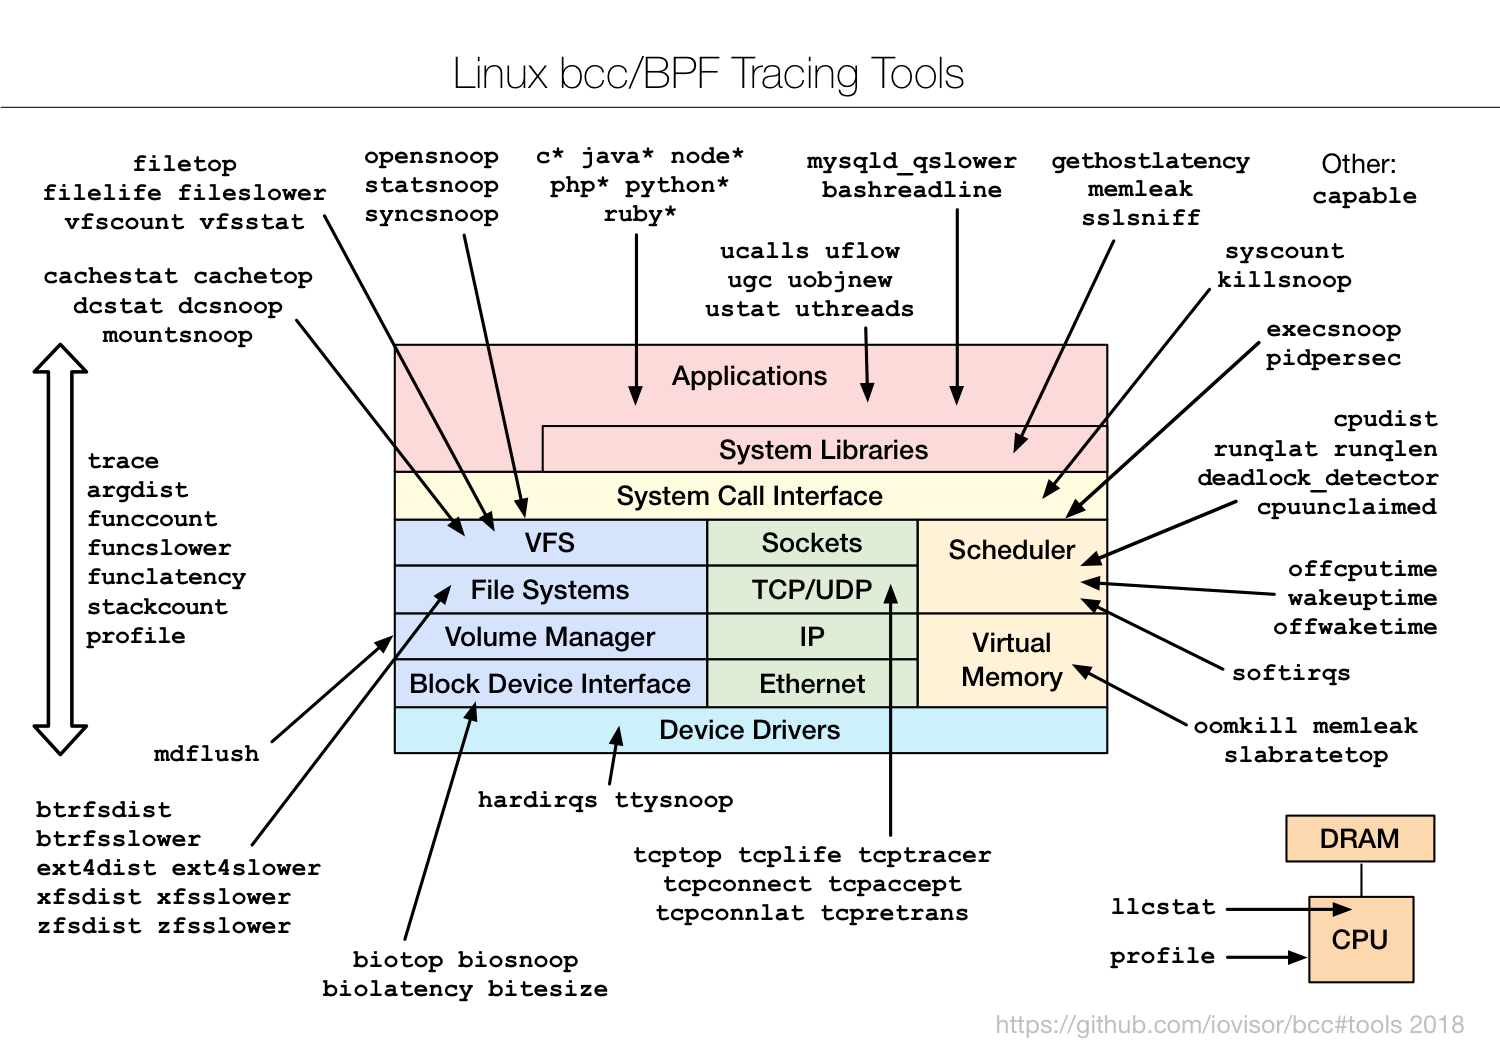
eBPF和BCC
eBPF以及BCC的原理和用途,以及BCC系列工具的用法:
- Linux内核功能eBPF入门学习(一):BPF、eBPF、BCC等基本概念
- Linux内核功能eBPF入门学习(二):BCC中的eBPF应用与bpftrace等
- BCC Tutorial
- BCC Python Developer Tutorial
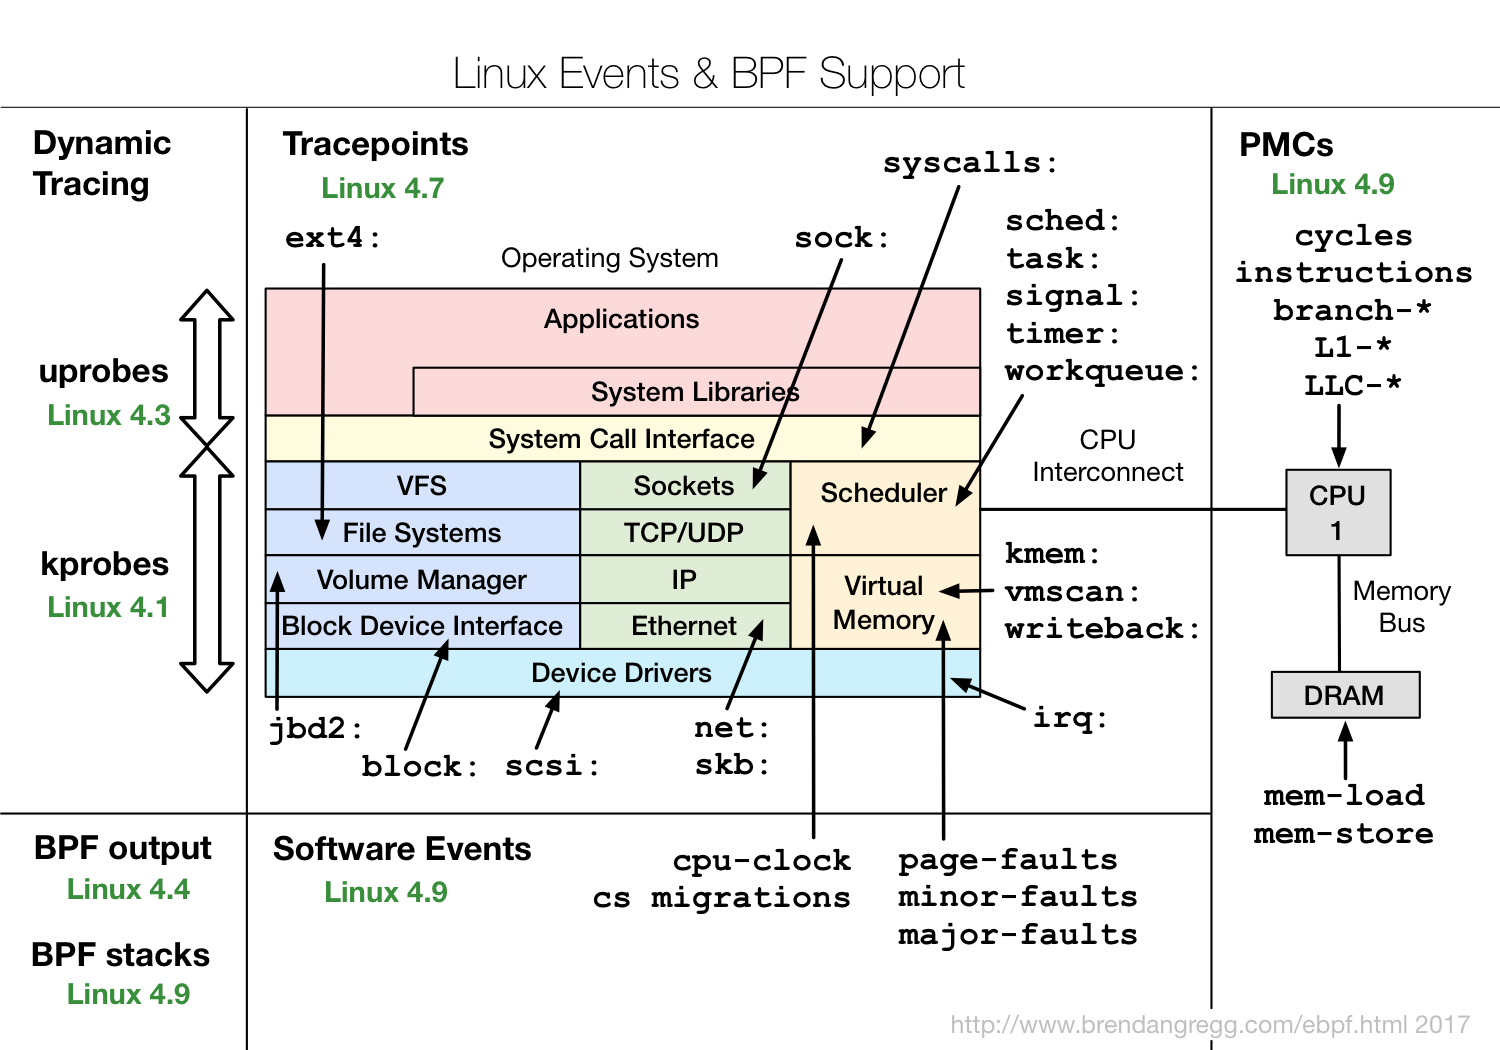
- BPF Features by Linux Kernel Version
CentOS中用yum直接安装,有协议额
yum install bcc-tools
命令安装在/usr/share/bcc/tools/中:
$ ls /usr/share/bcc/tools/
argdist       dbstat               javacalls       offcputime   rubyobjnew   tcplife
bashreadline  dcsnoop              javaflow        offwaketime  rubystat     tcpretrans
biolatency    dcstat               javagc          oomkill      runqlat      tcpstates
如果遇到下面的错误,说明内核版本太低,不支持相关特性:
[[email protected] phops]# /usr/share/bcc/tools/execsnoop
In file included from <built-in>:2:
/virtual/include/bcc/bpf.h:13:10: fatal error: 'linux/bpf_common.h' file not found
#include <linux/bpf_common.h>
         ^~~~~~~~~~~~~~~~~~~~
1 error generated.
Traceback (most recent call last):
  File "/usr/share/bcc/tools/execsnoop", line 166, in <module>
    b = BPF(text=bpf_text)
  File "/usr/lib/python2.7/site-packages/bcc/__init__.py", line 318, in __init__
    raise Exception("Failed to compile BPF text")
Exception: Failed to compile BPF text
BPF Features by Linux Kernel Version汇总了每个特性需要的最低内核版本,下图提供了部分信息:
BCC Python Developer Tutorial中介绍了eBPF应用程序的开发方法,掌握以后可以自行开发追踪工具。
支持旧内核的SystemTap
和eBPF根植于内核不同,SystemTap是独立于内核的,并且在RHEL系统中好用,在其它发行版上容易出现各种异常问题。eBPF是比较新的内核特性,对内核版本要求高,SystemTap的先于eBPF诞生,支持3.x等旧版本的内核。
容器动态追踪sysdig
Sysdig vs DTrace vs Strace: a Technical Discussion