报文追踪
用stap和perf定位丢失的报文
stap的安装方法:
yum install systemtap kernel-devel yum-utils kernel
stab-prep
用下面的脚本跟踪内核函数kfree_skb的调用位置,也就是丢弃报文的位置:
#! /usr/bin/env stap

############################################################
# Dropwatch.stp
# Author: Neil Horman <[email protected]>
# An example script to mimic the behavior of the dropwatch utility
# http://fedorahosted.org/dropwatch
############################################################
# Array to hold the list of drop points we find
global locations
# Note when we turn the monitor on and off
probe begin { printf("Monitoring for dropped packets\n") }
probe end { printf("Stopping dropped packet monitor\n") }
# increment a drop counter for every location we drop at
probe kernel.trace("kfree_skb") { locations[$location] <<< 1 }
# Every 5 seconds report our drop locations
probe timer.sec(5)
{
  printf("\n")
  foreach (l in locations-) {
    printf("%d packets dropped at %s\n",
           @count(locations[l]), symname(l))
  }
  delete locations
}
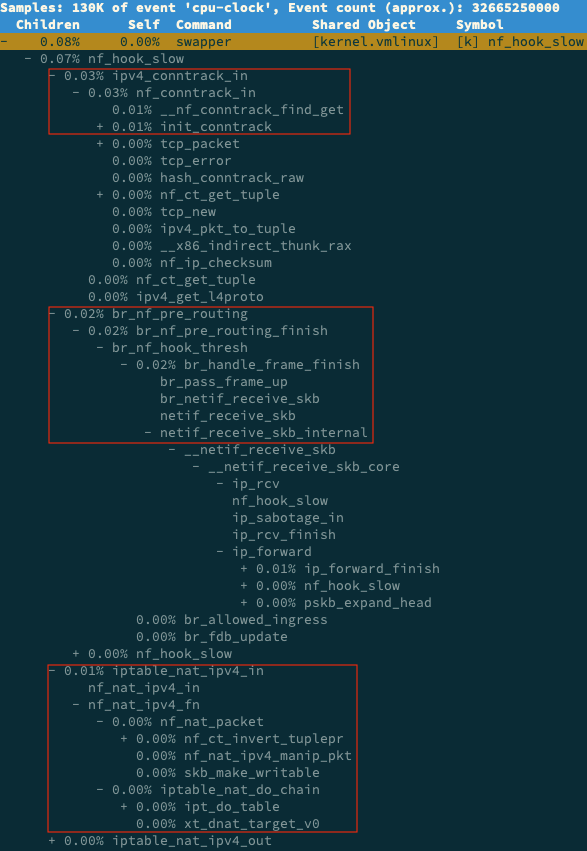
输出结果样式如下,下面的输出表明报文在nf_hook_slow中被丢弃:
10031 packets dropped at nf_hook_slow
676 packets dropped at tcp_v4_rcv

7284 packets dropped at nf_hook_slow
268 packets dropped at tcp_v4_rcv
用perf进一步定位,在perf report中展开内核函数nf_hook_slow:
$ perf record -a -g -- sleep 30
$ perf report -g graph,0
tcpdump捕获报文
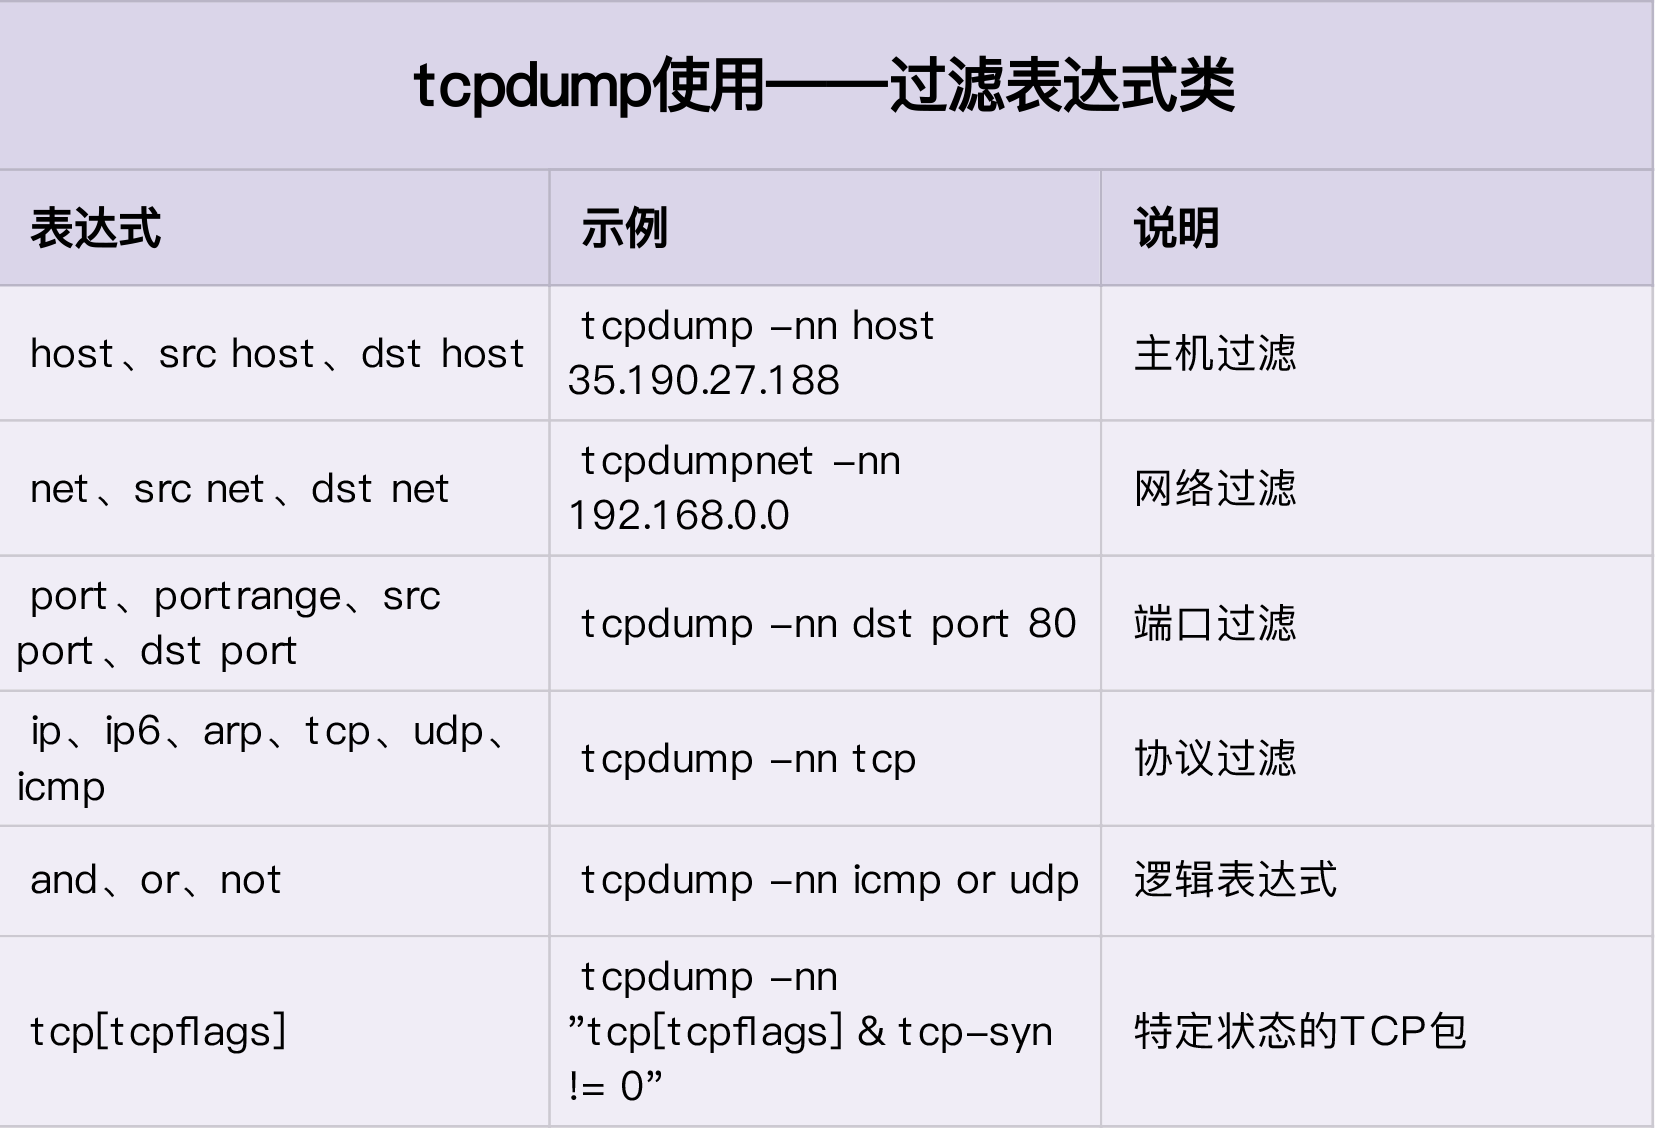
tcpdump过滤表达式: